Stats NZ paints by numbers
02 Aug 2017, Featured, Industry Updates

In an effort to better understand the volume of New Zealand’s dwelling stock and the amount of residential construction activity being undertaken, Stats NZ has published an experimental report – Subnational dwelling completion and stock estimates – with some interesting findings
Due to the “work-in-progress” nature of the report, which is based on an experimental model using existing data sources, Stats NZ advises that its findings should not be considered final. However, it does suggest some interesting trends.
Lag times vary
The average lag time nationally between a consent being issued and a dwelling being completed was estimated at about ten months, compared with an average of about six months in 1998 (which is built into the current Dwelling and Household Estimates statistics).
As the models were refined, it was found that there were statistically significant variations in the lag time between some territorial authorities and the national average.
In Hamilton, Matamata-Piako, Waipa, Tauranga, Selwyn, and Waimakariri, dwellings were completed faster than the national average; in the Far North, Whangarei, Kaipara, Thames-Coromandel, Wellington, Kaikoura, Buller and Grey, they were completed more slowly.
97% completion rate
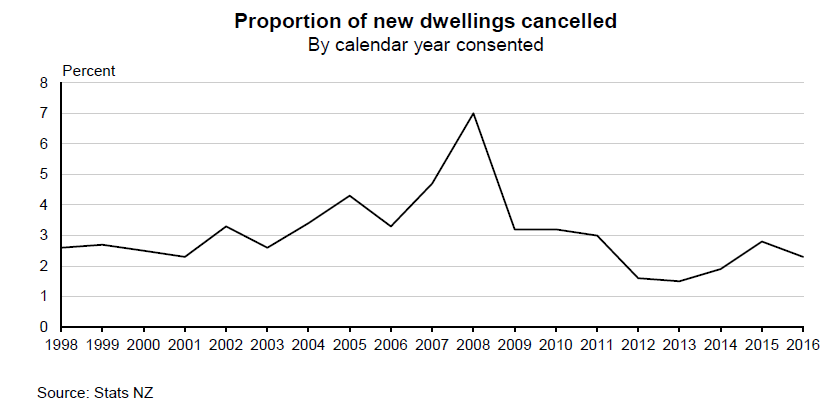
Typically, about 97% of consented new dwellings are built. The main exception occurred in 2008 during the global financial crisis, when only 93% of consented dwellings were built.
In the 12 months to March 2017, it’s estimated that 27,862 new dwellings were completed (compared with 30,626 dwellings consented in the same period). That’s 4% below the peak in the year to September 2005, when 29,018 dwellings are estimated to have been completed.
In the March 2017 quarter, 7,577 new dwellings are estimated to have been completed – just shy of the series peak in the September 2005 quarter when 7,604 new dwellings were completed. The series low was in the September 2011 quarter, when 3,149 new dwellings were completed.
Method behind the madness
The monthly Building Consents Issued report is currently the most informative sub-annual and sub-national dataset on construction activity in New Zealand. However, it doesn’t answer the question of whether all the consented dwellings get built or how long this takes.
The quarterly Dwelling and Household Estimates report provides a national dwelling stock estimate between census periods. It extrapolates out from the most recent census using building consent numbers lagged by six months and multiplied by a weighting factor (eg, to allow for demolitions, consents not fulfilled, unconsented dwellings).
However, it currently only produces national stock estimates; the weighting factor can only be recalculated after each census and the analysis in this latest report indicates that the six-month construction lag on consents issued is too short.
Stats NZ currently has limited access to territorial authority data on final inspections and code compliance certificates, so it focused on what Building Consents Issued and the Quarterly Building Activity Survey (QBAS) could reveal about dwelling completion and, therefore, stocks.
Stats NZ only included building consents for new residential dwellings (ie, houses, apartments, townhouses, flats, minor household units, and licence-to-occupy retirement village units), and excluded alterations and additions. It counted each new dwelling separately – eg, a building consent for one apartment building with 50 apartments would be counted as 50 new dwellings.
For each dwelling consent, two variables are required:
- Cancellation: the probability the consented dwelling(s) didn’t progress to completion.
- Lag: how many months elapsed from when the dwelling(s) were consented until they were completed.
From these variables, Stats NZ derived:
- The number of new dwellings completed (eg if 100 new dwellings had a 2% chance of cancellation, then 98 of them can be expected to have been completed).
- The quarter of completion (eg a consent issued in January 2016, lagged by nine months, would be completed in the October 2016 quarter).
For more information, visit: http://innovation.stats.govt.nz/initiatives/experimental-dwelling-estimates/
Disclaimer: This work focuses solely on residential/private housing supply. It currently excludes any work on housing stock reduction, housing demand, occupancy, affordability, suitability, or security of tenure. This data should not be considered final and Stats NZ advises against using the data in decision-making.
Register to earn LBP Points Sign in