Month-on-month consents rise
18 Mar 2025, Industry News, News, Stats
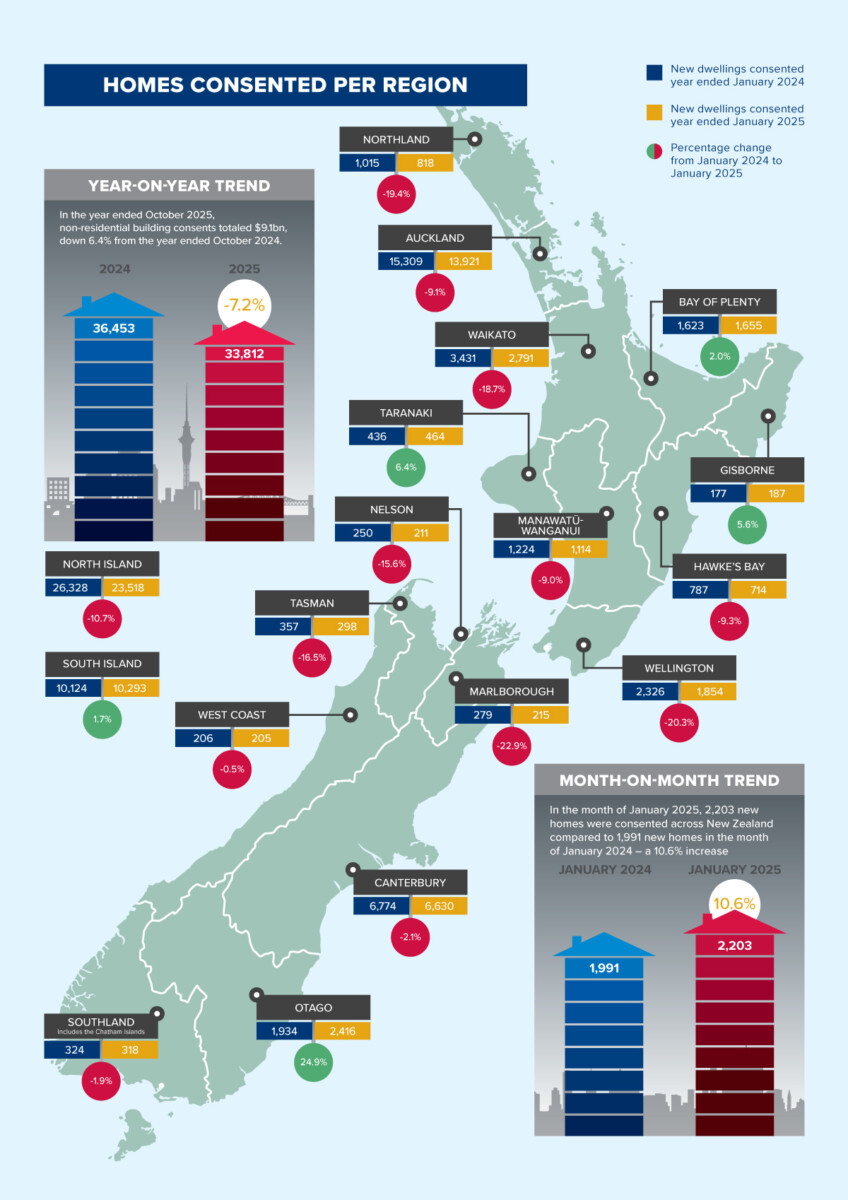
Consent numbers for the month of January 2025 were higher than in the month of January 2024 – although they still lagged below consent volumes experienced in the last three years
There were 2,203 new homes consented in the month of January 2025 – a 10.6% rise from the 1,991 homes consented in January 2023.
“While January 2025 saw an increase in homes consented compared to January 2024, it still remains below the levels seen in January 2022 and 2023,” said Stats NZ Economic Indicators spokesperson Michael Heslop.
Of the 2,203 new homes consented, there were 1,077 stand-alone houses (+19.8% compared with January 2024) and 1,126 multi-unit homes (+3.1%). Of the multi-unit homes, there were 968 townhouses, flats and units (+7.7%), 90 retirement village units (+28.6%) and 68 apartments (-44.7%).
Despite the rise in monthly consents, there was a drop in the number of homes consented in the year ended January 2025 with 33,812 (-7.2% compared with the year ended January 2024).
In the year ended January 2025, there were 17,854 multi-unit homes consented (-14.8%) and 15,958 stand-alone houses (+2.9%).
Of the multi-unit homes consented in the year ended January 2025, there were 14,210 townhouses, flats, and units (-14.9%), 1,926 apartments (-14.8%) and 1,718 retirement village units (-13.5%).
As annual consent numbers have reduced, so have floor areas for new homes. In the year ended January 2025, the total floor area of consented new homes decreased by 7.2% when compared to the year ended January 2024 (4.7m m2 vs 5.1m m2).
“The total floor area of new homes consented in the year to January 2025 was the lowest for a January year since 2015,” said Heslop.
Regional outliers
Four regions consented more dwellings in the year ended January 2025 compared to the previous year. Bay of Plenty consented 1,655 new homes (+2%), Gisborne 187 new homes (+5.6%), Taranaki 464 new homes (+6.4%), and Otago 2,416 new homes (+24.9%).
The four regions with the most consents issued were Auckland (13,921; -%9.1), Canterbury (6,630; -2.1%), Waikato (2,791; -18.7%) and Wellington (1,854; -20.3%).
Consents down per 1,000 residents
In terms of dwellings consented per 1,000 residents, the figures for the year ended January 2025 declined compared with the year ended January 2024 (6.3 vs 6.9).
Three regions consented above national levels: Auckland (7.7), Canterbury (9.5), and Otago (9.4).
Non-residential building consents down
In the year ended January 2025, non-residential building consents totalled $8.9bn, down 9.7% from the year ended January 2024. The building types with the highest value were:
- Offices, administration and public transport buildings – $1.8bn (+18%).
- Hospitals, nursing homes, and health buildings– $1.3bn (-9.4%).
- Storage buildings – $1.2bn (-22%).
Building activity for December quarter also down
The seasonally adjusted volume of building work in the December 2024 quarter fell by 4.4% to $7.4bn when compared with the September 2024 quarter. Residential building work dropped 4.9% to $4.5bn and non-residential building work fell 3.1% to $2.8bn over the same period.
“There has been a downward trend in building activity volume since the most recent peak in the September 2022 quarter,” said Heslop. “Residential building activity volume reached its lowest level in over four years, in seasonally adjusted terms.
“The fall in residential building activity has been driven by a decrease in new homes consented over the last two and a half years.”
The seasonally adjusted building activity volume series removes the effects of typical seasonal patterns and changes to construction costs. Volumes are calculated at September 2022 quarter prices. Residential construction prices rose 0.3% in the December 2024 quarter.
The value of building work put in place in the year ended December 2024 dropped 6.4% to $34bn, when compared to the year ended December 2023. Value estimates of building work put in place, in contrast to volume estimates, include changes to building costs over time (such as material and labour costs).

Register to earn LBP Points Sign in